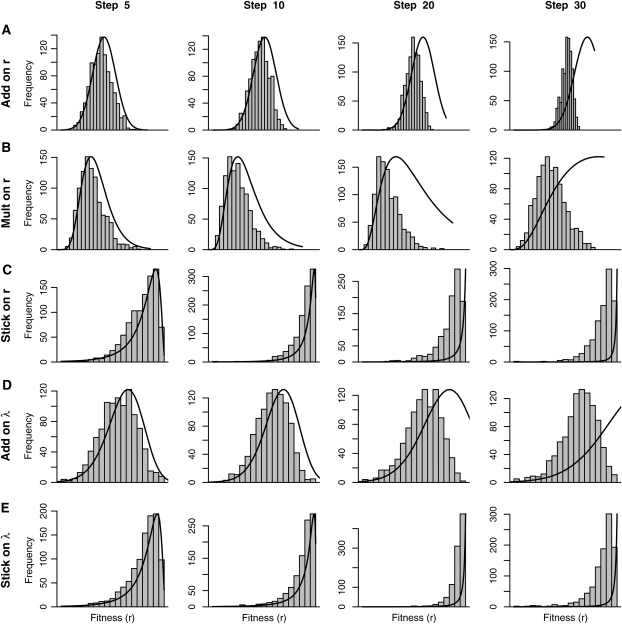
Figure 4 .
(A–E) Distributions of fitness achieved at the indicated step (top) under the six models (left) where the equivalent “add on r” and “mult on λ” are consolidated. Shaded bars show frequency of fitness over 1000 walks on the same landscape while solid lines are predicted distributions based on asymptotic results in the Appendix. The x-axis (Malthusian fitness) is the same for all panels. When mutations affect r, the additive, multiplicative, and stickbreaking models (A–C) yield normal, log-normal, and negative log-normal distributions of fitness.

