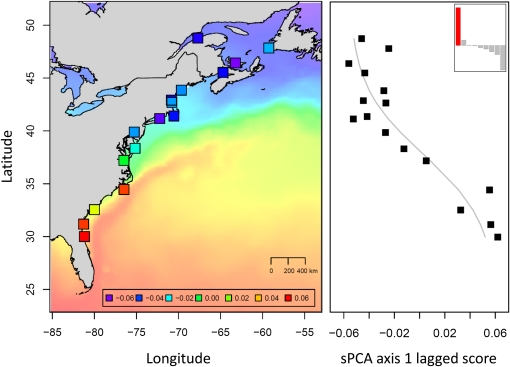
Figure 2 .
Synthetic multilocus spatial variation component in the 2008 glass eels. The spatial component analysis was based on genetic variation at the eight loci significantly associated with explanatory variables in the GLASS8 category. The 16 sampling sites are represented on the map by squares colored according to each locality’s lagged score on the first principal component, as indicated in the inset. Sea-surface temperatures averaged across the whole sampling period (from January 8 to July 16, 2008) are represented on the same color scale for indication (purple, 0.2°; red, 27.3°). The plot on the right shows the shape of the synthetic multilocus cline, as well as the decomposition of the product of the variance and the spatial autocorrelation into positive, null, and negative components (top right corner). The clinal structure corresponds to the highly positive eigenvalue in red.

