
Figure 4.
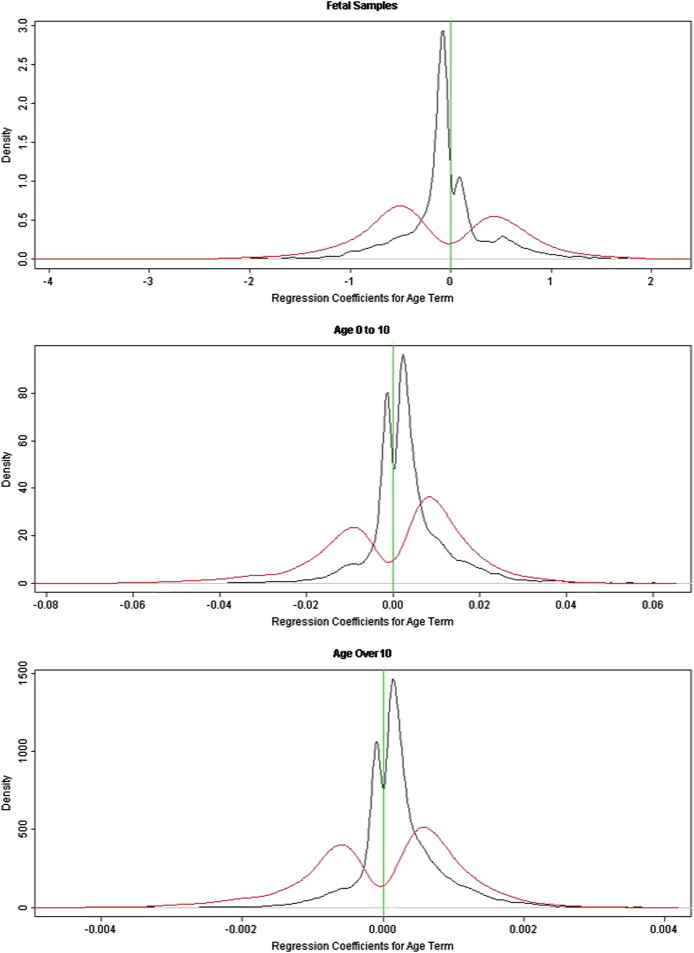
Depiction of Age-Related Changes in DNA Methylation in Three Life Stages as a Function of CpGI Context
Black lines show density distributions of regression coefficients for age term for the CpG loci located in the CpGIs. Red lines show density distribution of regression coefficients for age term for the CpG loci located outside the CpGIs. More loci are demethylated than hypermethylated during the fetal period, whereas increased methylation with age dominates in postnatal life (childhood and postchildhood). The effect sizes are larger for loci outside the CpGIs than those located in the CpGIs.