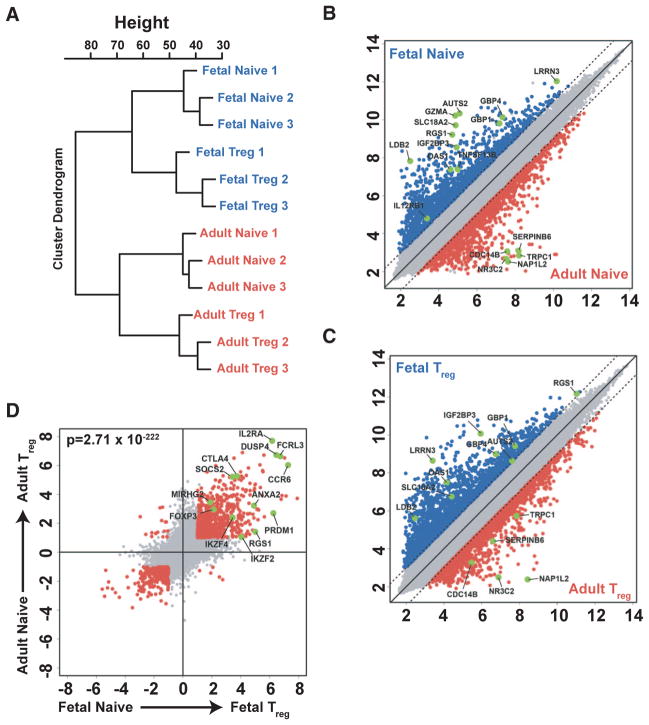
Fig. 2.
Fetal and adult naïve CD4+ T cells show significant differences in gene signature. (A) Unbiased cluster analysis on the basis of gene expression for fetal (mLN) and adult (PBMC) naïve CD4+ T cells and CD4+CD25+ Tregs. (B–D) Scatterplots of pairwise global gene expression comparisons comparing (B) fetal naïve CD4+ T cells and adult naïve CD4+ T cells, (C) fetal and adult CD4+CD25+ Tregs, and (D) CD4+CD25+ Tregs and naïve CD4+ T cells (in both fetal and adult). Gene expression values are plotted on a log scale. Genes that were differentially expressed between groups (determined using a 5% false-discovery rate and fold-change >= 2) are indicated in red and blue. Specific genes that were differentially expressed based on age or subset are highlighted in green.

