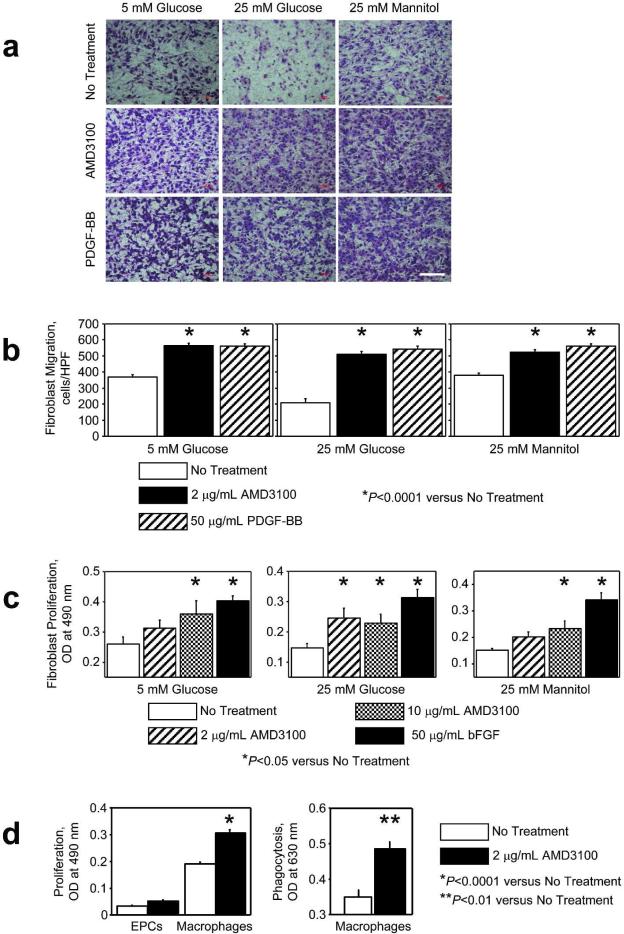
Figure 5. Activity of diabetic mouse fibroblasts, macrophages, and EPCs.
(A, B) Fibroblast migration toward 0 μg/mL and 2 μg/mL AMD3100 or 50 μg/mL PDGF-BB (positive control) was evaluated via a modified Boyden's chamber assay in 5 mmol/L or 25 mmol/L D-glucose, or in 25 mmol/L D-mannitol to serve as an osmotic control for the high-glucose condition. Bar=100 μm. (C) Fibroblasts were treated with or without 2 μg/mL or 10 μg/mL AMD3100, or with 50 μg/mL basic fibroblast growth factor (bFGF, positive control), for 50 hours, and then fibroblast proliferation was evaluated via the CellTiter 96 nonradioactive cell proliferation assay in 5 mmol/L or 25 mmol/L D-glucose, or in 25 mmol/L D-mannitol to serve as an osmotic control for the high-glucose condition. (D) EPC proliferation, macrophage proliferation, and macrophage phagocytosis activity were assessed after treatment with or without 2 μg/mL AMD3100 for 50 (proliferation) or 24 (phagocytosis) hours; proliferation was assessed via the CellTiter 96 nonradioactive cell proliferation assay, and phagocytosis was assessed via the CytoSelect™ 96-well phagocytosis assay (red blood cell, colorimetric format).

