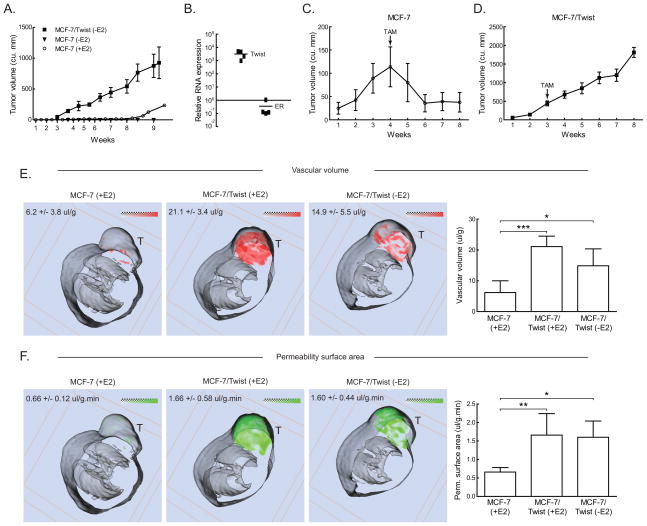
Figure 4. In vivo growth characteristics of MCF-7 and MCF-7/Twist cells.
A. Line chart showing growth of 1 × 10⁶ MCF-7 cells (without E2, solid triangles; with E2, hollow circles) and MCF-7/Twist cells (without E2, solid squares) orthotopically implanted into female SCID mice and allowed to grow for the time indicated. Tumors were measured weekly.
B. MCF-7/Twist tumors from mice (n=4) were excised and Twist and ER transcript levels determined by qRT-PCR. The graph depicts relative differences in Twist and ER transcript levels.
C, D. Growth of MCF-7 and MCF-7/Twist tumors over eight weeks treated with tamoxifen. tamoxifen pellet implantation is indicated by an arrow.
E, F. Representative false color coded MRI generated 3-D transverse slices of MCF-7 and MCF- 7/Twist xenografts in the mammary fat pad. Red and green represent the distributions of vascular volume (VV) and vascular permeability surface area product (PS), respectively. Gray-scale images represent the mouse body; while tumors are seen on top and indicated by “T”. Averaged values from all mice are indicated in the figures as well as displayed on the histograms at the right. Images depicted are a representative sample of five mice for MCF-7(+E2), six mice for MCF-7/Twist(−E2), and six mice for MCF-7/Twist (+E2).

