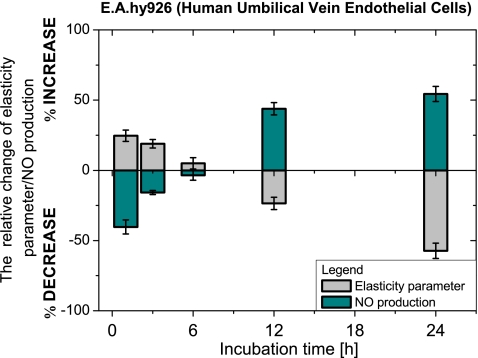
Fig. 8.
EA.hy926 elasticity and NO production changes in relation to control samples for different stimulation periods with TNF-α. The anticorrelation between those two parameters can be observed. Elasticity parameter reflects cell stiffness, i.e., the lower is the cell elasticity parameter, the softer is the cell

