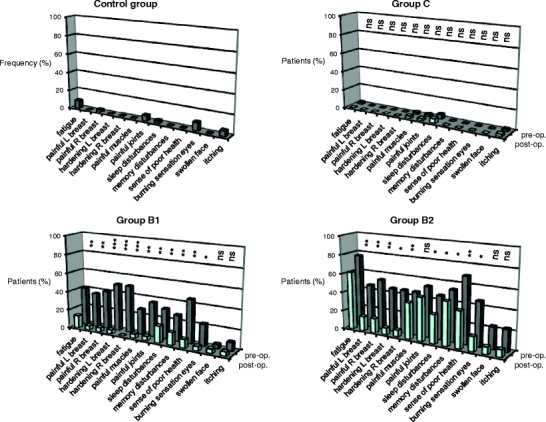
Fig. 2.

Complaints reported by patients and controls. The frequency of complaints (specified below the graphs) reported by the different patient groups before (pre-op.) and after (post-op.) MH implant insertion (C group) or replacement of their breast implants (B1 and B2 groups), and those reported by the Control group without implants is illustrated by the graphs. The results were analysed by paired t tests: ns not significant, * p < 0.05; ** p < 0.01; *** p < 0.001
