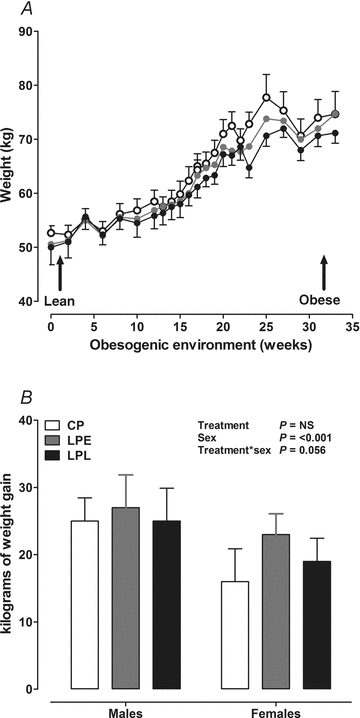
Figure 3. Weight gain during exposure to an obesogenic environment in adult sheep.

Data are means ± SEM for control protein (CP, n = 6), low protein early (LPE, days 0–65 gestation, n = 7) and low protein late (LPL, days 66 to term, n = 6). There were 3 males and 3 females in CP and LPL and 3 males and 4 females in LPE. A, absolute body weight gain; B, kgs of weight gain after exposure to the obesogenic diet. Data were analysed by General Linear Model for the fixed effects of treatment, gender and time with testing for suitable interactions (Genstat v13, VSNi, UK). NS, non-significant.
