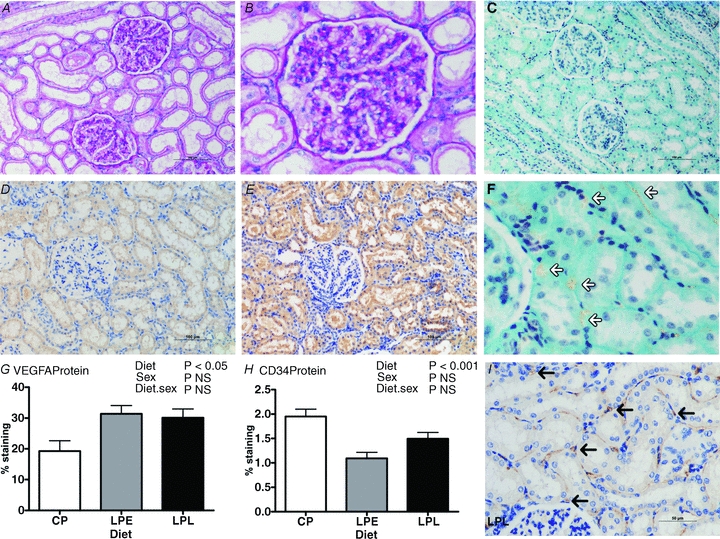
Figure 5. The effect of a low protein maternal diet on adult offspring renal structure and vascularisation as assessed by expression and abundance of markers for renal endothelial cells.

Data are means ± SEM for control protein (CP, n = 6), low protein early (LPE, days 0–65 gestation, n = 7) and low protein late (LPL, days 66 to term, n = 6). There were 3 males and 3 females in CP and LPL and 3 males and 4 females in LPE. Data were analysed by General Linear Model for the fixed effects of treatment and sex with their interaction (Genstat v13, VSNi, UK). A and B, representative histological sections from the LPE group (A, magnification ×200; B, magnification ×400) stained with periodic acid Schiffs reagent shows normal kidney structure; C and F, representative histological section (×200) from the LPE group stained with trichrome; D and E, representative histological sections with immunohistochemical staining for vascular endothelial growth factor A (VEGFA) in CP (D) vs. LPE (E), and G shows quantification of VEGFA staining (using ImagePro MC); H, quantification of CD34 stained sections (using ImagePro MC) and I, a representative section from CP, immunostained for CD34 (black arrows indicate endothelial cells). Scale bars in A, C, D and E, 100 μm; in I, 50 μm.
