Fig. 6.

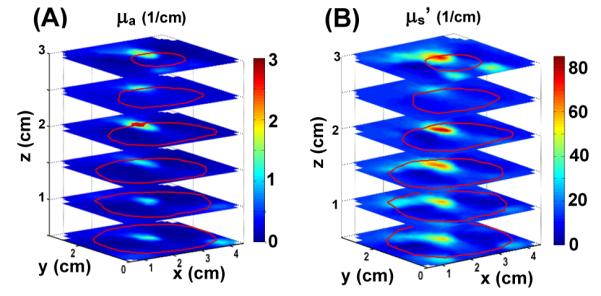
Volumetric distributions of (A) μa and (B) μs’, respectively, for an in-vivo prostate. The prostate contours (red lines) at different z planes are shown in both cases.

Volumetric distributions of (A) μa and (B) μs’, respectively, for an in-vivo prostate. The prostate contours (red lines) at different z planes are shown in both cases.