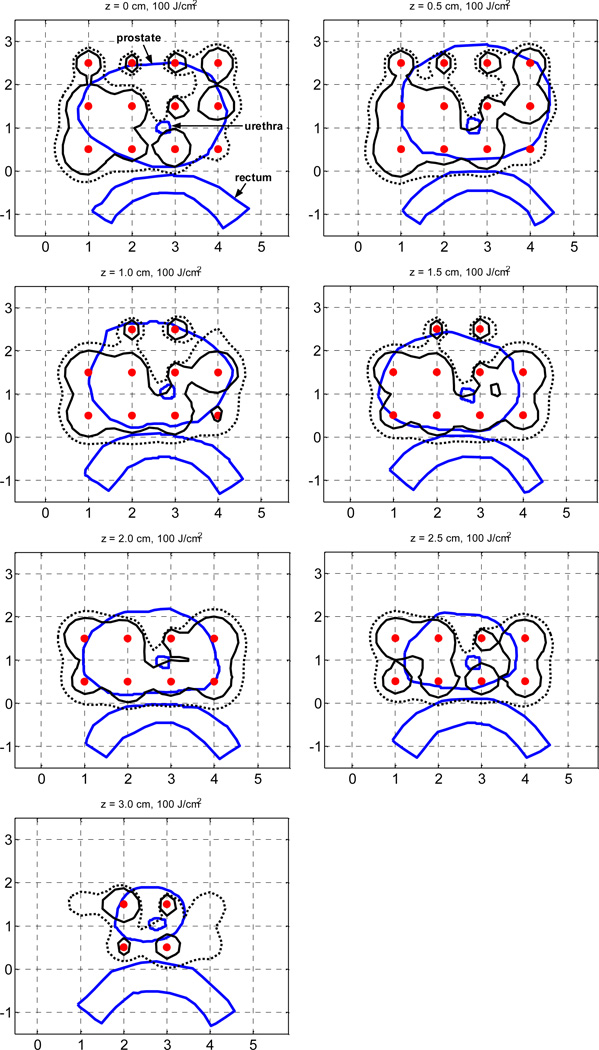
Figure 3.
Comparison of 100% isodose lines of the reference clinical plan (RCP) (dotted line) and the homogeneous Cimmino optimized plan (solid line). Homogeneous optical properties (µa = 0.3 cm−1 and µs' = 14 cm−1) are assumed to generate the optimal plans. The isodose lines were calculated with the FEM model using heterogeneous optical properties (as illustrated in Fig. 2) Source locations are marked by “ ”.
”.

