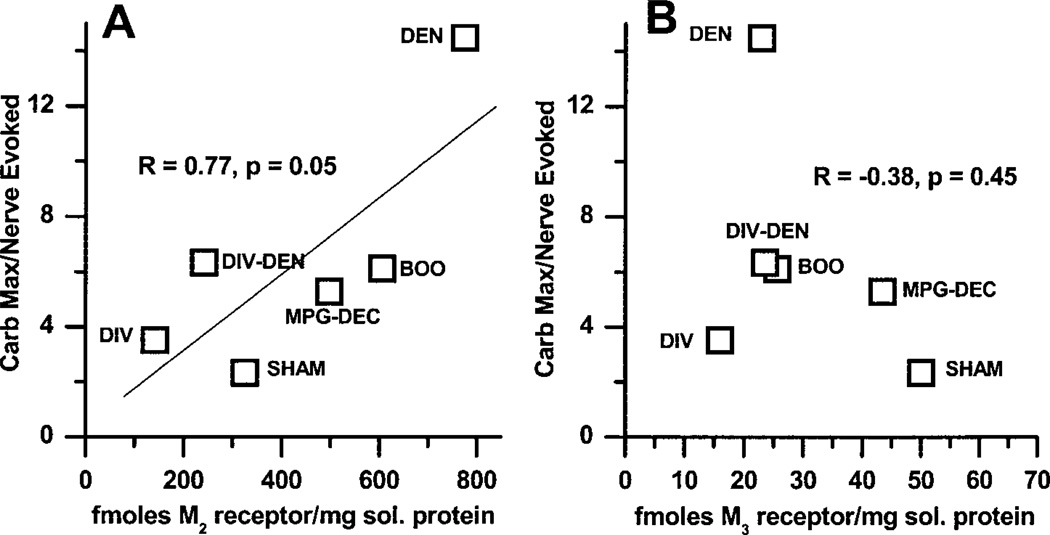
Fig. 5.
Correlation of muscarinic receptor subtype density with functional denervation. For each individual muscle strip the ratio of the carbachol maximum:EFS-induced contraction was determined. The average of the individual muscle strips for each experimental group for functional denervation is plotted vs. the immunoprecipitation data for M2 receptor density (A) and M3 receptor density (B). The ratio of the average carbachol maximum to the average EFS contraction displayed in Fig. 2 does not equal the average of the individual ratios for the strips. The density of M2 receptors correlates with functional denervation. No correlation between the M3 receptor density and functional denervation is seen.

