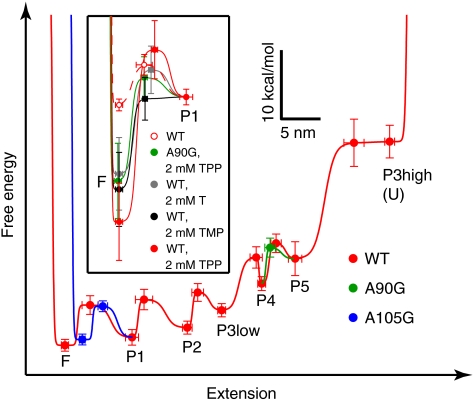
Fig. 2.
Reconstructed energy landscapes for thiC aptamers. The experimentally determined free energies for folded, unfolded, and intermediate states are plotted vs. extension, along with the transition energy barriers separating these for the WT, A90G, and A105G aptamers (mean ± s.e.; see SI Methods). States are labeled in the order that unfolding transitions occurred as the extension was raised (e.g., P1 is unfolded in the state marked “P1”); smooth curves (red, blue, green) connect the points. The landscapes for the WT (red filled circles) and mutant aptamers (blue and green filled circles) were indistinguishable except where indicated. Landscapes are shown tilted by the work done by 8 pN applied force. Inset, view of the F-to-P1 transition illustrating the stabilization of the F state by ligand binding under the indicated conditions (legend).

