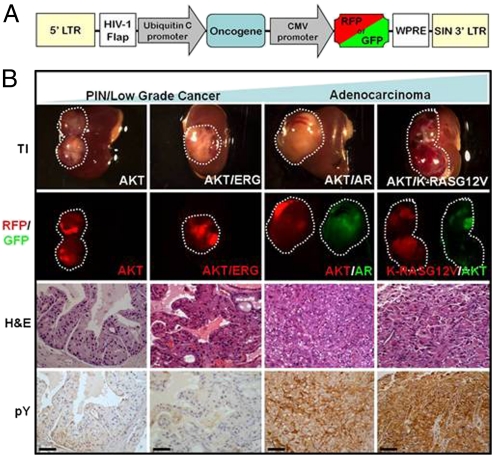
Fig. 2.
Phosphotyrosine expression is increased during prostate cancer progression. (A) Lentiviral vector diagram displaying the organization of oncogene and fluorescent marker expression used in these tumors. (B) Gross and histological morphology of each tumor type after 12-wk engraftment in SCID mice using the prostate regeneration protocol. Fluorescence corresponds to expression of a particular oncogene. IHC staining of progressive mouse tumor phenotypes reveals an increasing gradient of phosphotyrosine expression with more aggressive tumors expressing higher levels than indolent tumors. TI, transillumination; H&E, hematoxylin and eosin; pY, phosphotyrosine. (Scale bars, 50 μm.)

