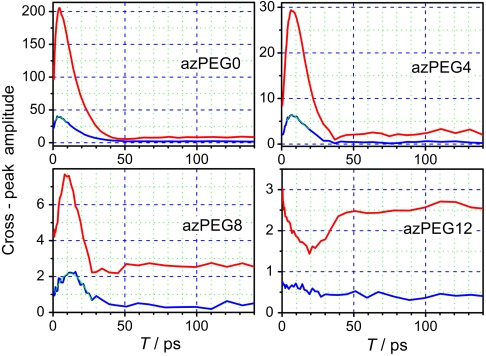
Fig. 3.
Waiting-time dependencies for the N ≡ N/1,742 cm-1 (red) and N ≡ N/1,778 cm-1 (blue) cross-peaks for the four compounds indicated. The best fits with the asymmetric bell-shaped function, y = y0 + A∗ exp(- exp(-z) - z + 1), where z = (x - xc)/w, are shown for the N ≡ N/1,778 cm-1 cross-peaks with thin lines (cyan).

