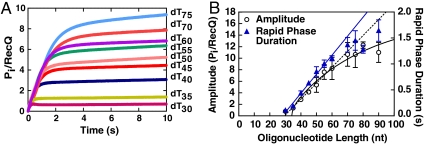
Fig. 2.
In a single round of translocation, RecQ moves more than one nucleotide per molecule of ATP hydrolyzed. (A) Kinetic traces for the release of phosphate by RecQ for oligonucleotides of varying lengths. Each trace was fit to Eq. 3 to give an amplitude and duration for phosphate release. (B) Plot of the amplitude (black circles) and duration (blue triangles) for the rapid phase in (A) versus DNA length. The dashed black line is a linear fit of the amplitude data up to 60 nt; the solid black line is the best fit of the data to Eq. 8. The solid blue line is a linear fit of the duration data up to 60 nt.

