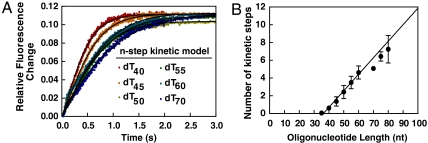
Fig. 4.
Kinetic modeling of translocation by RecQ. (A) The kinetic traces from Fig. 3 were globally fit to Eq. 6. Shown are the best fits to the n-step kinetic model (black line) using the parameters summarized in Table 1. (B) Plot of the maximum number of kinetic steps as a function of oligonucleotide length. The data are linear with respect to the DNA lengths up to 60 nucleotides. The solid line is a fit to Eq. 7. Fitting of Eq. 7 to three datasets yields a kinetic step size of 5.3 ± 0.9 nt per kinetic step, and a binding site size of 34 ± 3 nt.

