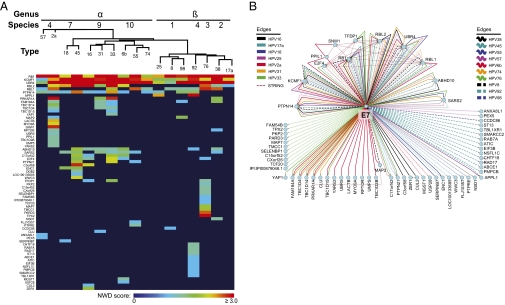
Fig. 2.
HCIPs of HPV E7s. (A) Heat map representing PPIs identified by IP-MS/MS and CompPASS analysis when one of 17 unique HPV E7 proteins was used as a bait. Colors in the heat map represent NWD scores, whereby an NWD score of 1 or greater defines a high-confidence interaction. An interactor is included on the heat map if it was detected at least once in any of several repeat experiments with some of the E7 baits. E7 baits were ordered across the top of the map according to the established HPV phylogeny (1); HCIPs were arranged by using a Manhattan distance hierarchical clustering analysis. (B) Interactome representing HCIPs in complex with various HPV E7 baits.

