Fig. 1.
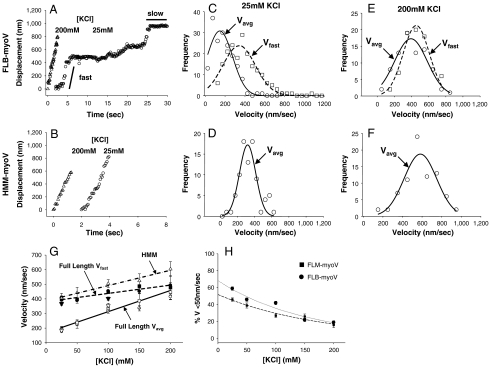
Ionic strength dependence of myoV displacements and velocities. Typical displacement versus time traces for FLB-myoV (A) and HMM-myoV (B) at 200 mM (triangles) and 25 mM (circles) KCl at 1 mM ATP. In A, solid lines highlight the periods of fast and slow processive movement (C–F) Velocity histograms for FLB-myoV and HMM-myoV at 25 mM and 200 mM KCl. Circles represent Vavg and squares represent Vfast. At 25 mM KCL Vavg and Vfast for FLB-myoV are 147 ± 10 nm/s and 343 ± 12 nm/s (n = 175), respectively, while Vavg for HMM-myoV is 320 ± 18 nm/s (n = 145). At 200 mM KCl, Vavg and Vfast for FLB-myoV are 394 ± 22 nm/s and 456 ± 17 nm/s (n = 80), respectively, while Vavg for HMM-myoV is 583 ± 19 nm/s (n = 115). (G) Vavg and Vfast as a function of ionic strength for the FL-myoV. FLB-myoV (open and closed circles), FLM-myoV (open and closed squares), YFP-FL-myoV (open and closed down triangles) and Vavg for HMM-myoV (open up triangles). Vavg of the FL-myoV is significantly slower than Vavg of HMM-myoV at all [KCl] (ANOVA, p ≤ 0.05). (H) The percentage of time that the FL-myoV spend traveling at slow processive speeds (%Vslow) vs. KCl concentration. Values are reported as mean ± S.E.M.

