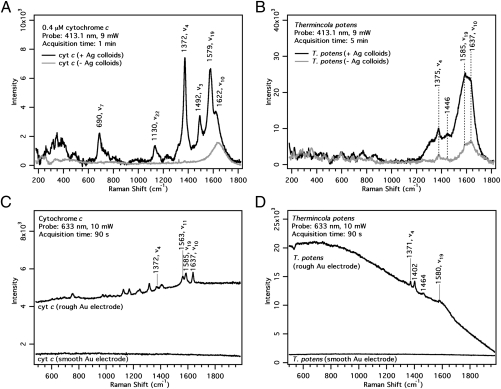
Fig. 3.
Resonance Raman, SERS and SERRS spectra of cytochrome c and T. potens with 413.1 nm laser excitation (A and B) and 633-nm laser excitation (C and D) (A) 0.4 μM cytochrome c and (B) T. potens in the presence (black traces) and absence (gray traces) of Ag colloids. (C) Cytochrome c and (D) T. potens on smooth and electrochemically roughened Au electrodes.

