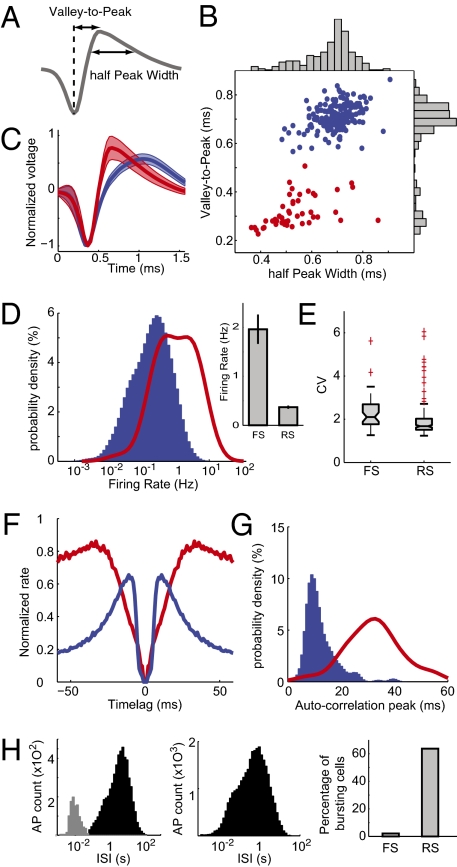
Fig. 2.
Separation of FS and RS cells based on spike waveform. (A) Valley-to-peak and half-peak widths were the two parameters chosen to describe spike waveforms. (B) Each cell's average waveform is represented in the 2D space of the previous two parameters. The two clusters were identified with a k-means algorithm representing in red FS and in blue RS cells. (C) Average spike waveform for the two groups. Shading represents SD. (D) Probability density of firing rates for the two groups. (Inset) Average ± SEM. (E) Box plot indicating interquartile distribution of coefficients of variation (CV) of ISIs. (F) Average autocorrelogram normalized to maximum for each group. (G) Distribution of autocorrelogram modes (time of maximum peak) for each group. (H) Distribution of ISIs for an example RS cell (Left) and an FS cell (Center). The gray part of the distribution indicates the ISI categorized as bursts. (Right) Percentage of cells classified as bursty for each cell type. AP, action potentials. In D and G, the density probabilities were computed from kernel-smoothing density estimates of the actual data and displayed such that the sum over the whole displayed interval is equal to 100 for each group.

