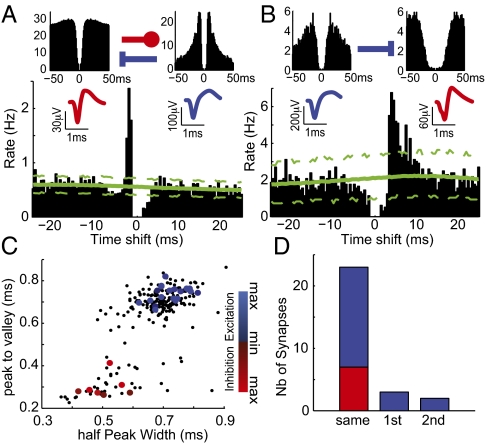
Fig. 3.
Putative monosynaptic connections reflect neuronal type. (A) Cross-correlogram (Lower, referenced to firing by the putative Int) implies reciprocal monosynaptic interactions between an FS Int and an RS Pyr cell identified by their autocorrelograms (y-axis display rate in Hz) and spike waveforms (Upper Left and Upper Right, respectively). The large peak in the cross-correlogram indicates that the putative Pyr cell is systematically firing ∼2 ms before the putative FS Int. Conversely, the decreased firing for 4 ms after the putative Int firing suggests that it inhibits the putative Pyr cell. Dashed green lines show the 99% confidence interval from jittered spike trains. (B) In this example a putative Pyr cell (reference of the cross-correlogram) tended to excite a putative Int at a latency of ∼3 ms. In A and B, cells were recorded on the same electrodes; because of the nature of spike detection, the central values of the cross-correlograms are thus null. (C) The sign and strength of the putative monosynaptic connections were matched to the spike's average waveform. Small dots, all neurons; large dots, identified cell that appeared to monosynaptically affect another cell. Color code for sign (blue, excitation; red, inhibition) and strength (dark, weak; light, strong) of the connection. (D) Total number of synaptic connections between pairs of cells recorded by the same first- or second-neighbor electrodes.

