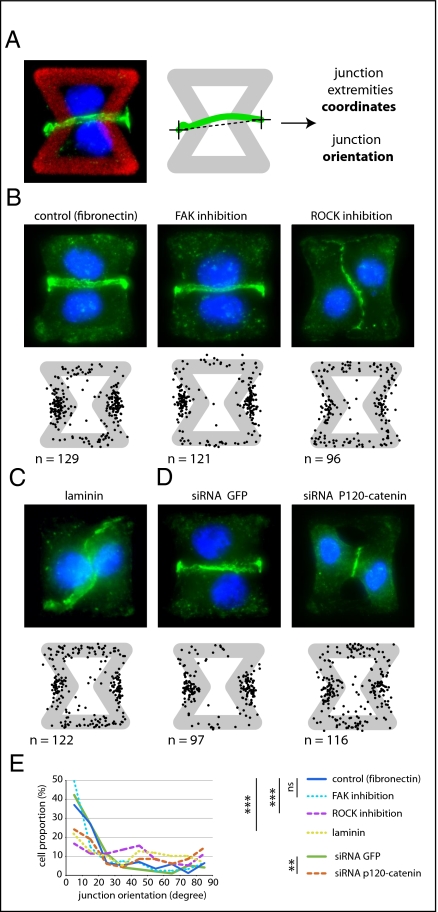
Fig. 4.
Cell contractility regulates intercellular junction positioning. (A) Immunostaining of α-catenin on cell doublets plated on [hourglass] (Left) (α-catenin in green, DNA in blue) allowed the detection and measurement of intercellular junction positions (Right). (B–D) The positions of junction extremities (black dots) were measured on cells treated for 6 h with PF-573228 (1 μM) to inactivate FAK or Y27632 (5 μM) to inactivate ROCK (B), cells plated on laminin-coated micropatterns (C), or cells pretransfected with siRNA against GFP or p120-catenin (D). Images are examples of treated cells (α-catenin in green, DNA in blue). More representative stainings are shown in Fig. S4. Micropattern width is 35 μm. (E) Curves indicate the proportion of junctions for each angular sector with the same set of data as in B and C. Differences between the two curves were compared using the Kolmogorov–Smirnov test; **, 0.5% and ***, 0.1% error probability in the rejection of the hypothesis that the two distributions are identical; ns indicates that the probability would be higher than 5%.

