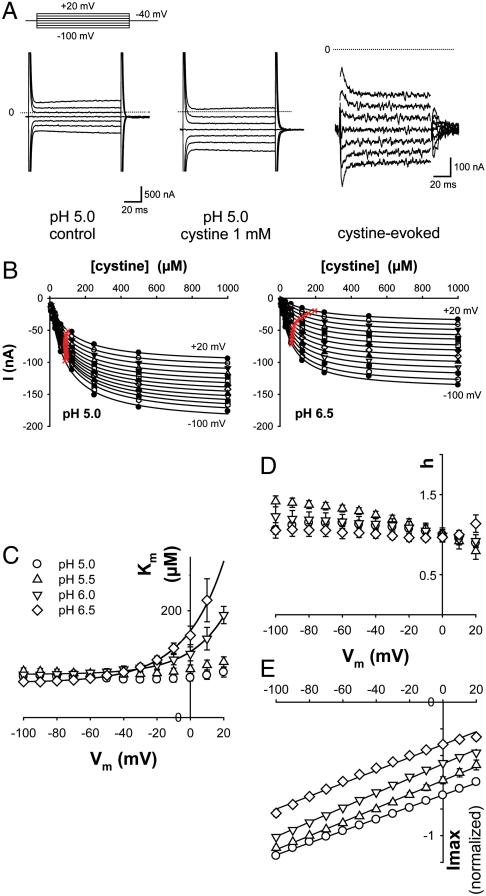
Fig. 3.
Voltage and pH dependence of steady-state kinetics. (A) Cystinosin-ΔGYDQL-EGFP oocytes were held at -40 mV and stepped to various potentials before and during cystine application. Raw OpusXpress traces are shown in the left and central panels. Subtracting these traces reveals the cystine-induced component (Right). The position of zero current is shown by the dotted lines. (B) Voltage steps were repeated for 8 cystine concentrations (8 μM-1 mM) at several pH values. Cystine-induced steady-state current follows Michaelis–Menten saturation kinetics. Half-maximal current is marked with a red cross. (C–E) Km for cystine, Hill number (h) and Imax derived from the saturation curves are plotted as a function of membrane potential (Vm) at 4 pHout values (4 to 9 oocytes). Because Imax depends on the amount of cystinosin present at the plasma membrane, data in E were normalized to the Imax value obtained at pH 5.5 and -80 mV. The voltage dependence of Km strongly depends on pHout, whereas Imax varies linearly with Vm in a pHout-independent manner. After multiplication by the mean Imax value at pHout 5.5 and -80 mV (-169 ± 24 nA), a slope of 0.84 ± 0.09 nA·mV-1 is obtained regardless of pHout.

