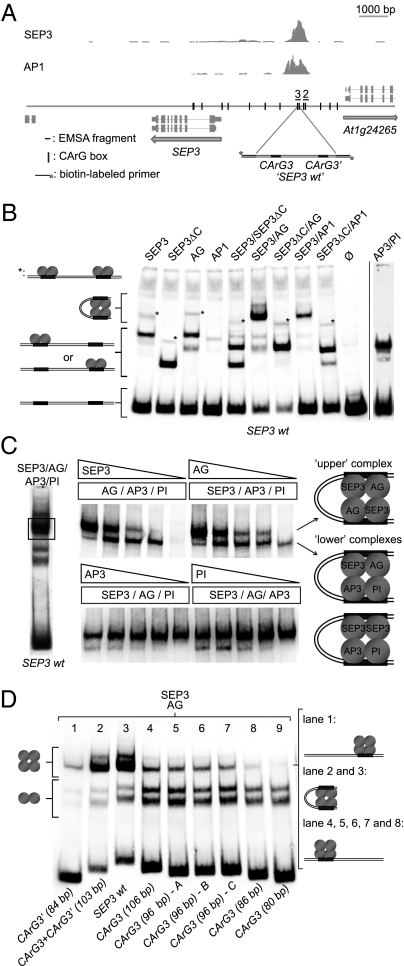
Fig. 2.
Assembly of the MADS-domain protein complexes in a distal region of the SEP3 promoter. (A) Graphic representation of the SEP3 locus with a 4.1-kb promoter region and the SEP3 and AP1 ChIP-SEQ profiles. Fragments used in the EMSA experiments were flanked with the biotin primers used for amplification and detection. Vertical lines in the sequence map indicate position of the CArG boxes. (B) EMSA of the different MADS-domain protein complexes with the SEP3 wild-type promoter fragment and possible model representations of formed protein–DNA complexes. (C) Left, EMSA of the SEP3/AG/AP3/PI protein mix with the “SEP3 wt” DNA fragment containing two CArG boxes. Center, EMSAs where the concentration of a single protein component was gradually reduced from approximately equimolar amounts to 0. Only the part of the gel containing the slow migrating complexes (rectangle in the left EMSA) is shown. Right, Model representation of the higher-order protein complexes formed in the presence of SEP3, AG, AP3, and PI binding to the SEP3 promoter fragment in vitro. (D) EMSA of the SEP3/AG protein mix with the truncated versions of the SEP3 wild-type DNA fragments. The SEP3 wt fragment was shortened from both 3′ and 5′ ends and contains either a single or double binding site. CArG3 (96 bp) – A, CArG3 (96 bp) – B, and CArG3 (96 bp) – C are different, randomized versions of the 3′-end flanking region of the CArG3 fragment.

