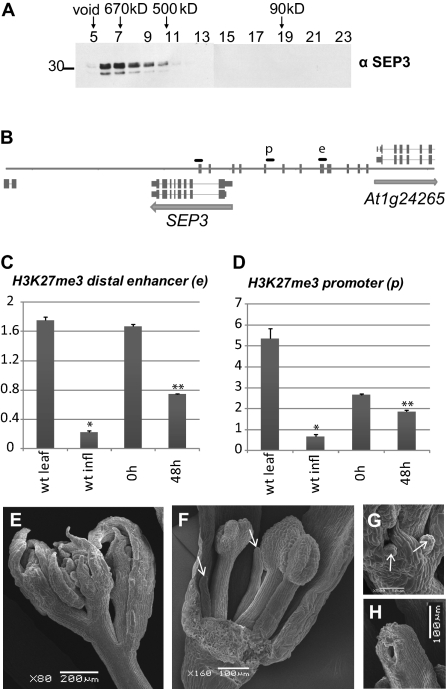
Fig. 3.
Interactions between MADS-domain transcription factors and other transcriptional regulators. (A) Gel filtration reveals that SEP3 is present in large nuclear complexes. (B) SEP3 promoter and genomic locus representation with the quantitative PCR fragments in the distal enhancer site (e) and weaker proximal promoter site (p). Fragments were designed according to ChIP-SEQ profiles of AP1 and SEP3 (see Fig. 2A). Vertical bars indicate CArG box sequences. (C) Enrichment analysis of H3K27me3 at the MADS binding site in the distal SEP3 enhancer (e). ChIP was analyzed by quantitative PCR; material was obtained from inflorescence tissue of 35S:AP1-GR ap1 cal before (0 h) or 48 h after dexamethasone treatment and then subjected to ChIP with antibodies specific to H3K27me3. Results are presented as fold enrichment of input chromatin. Graphs represent average values from triplicates. Error bars represent SE of the mean. Asterisks indicate values that are significantly different from wild-type leaves (*) or from untreated 35S:AP1-GR ap1 cal plants (**) (P < 0.05 using Student t test). (D) Enrichment analysis of H3K27me3 in the proximal SEP3 promoter (p). For both C and D, H3K27me3 signal is reduced 48 h after AP1 induction compared with signal in 35S:AP1-GR ap1 cal uninduced tissues. (E–H) Scanning electron microscopy (SEM) pictures of chr11 chr17 double mutant inflorescences. (E) Overview of an inflorescence showing aberrations in floral organ development. (F) Close-up of a dissected chr11 chr17 flower (sepal in front was removed) with malformed stamens and petals replaced by pin-like structures (see arrow). (G) Close-up of a developing chr11 chr17 flower showing outgrowth of pin-like structures that replace the petals. (H) Incompletely closed carpel.

