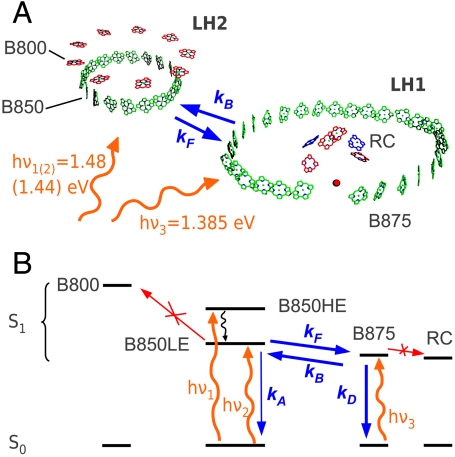
Fig. 1.
(A) Schematic of the BChls in LH2 and LH1/RC complexes from R. palustris. Straight and wiggly arrows represent the forward/backward ET processes and the pump photon energies, respectively. (B) Energy level scheme of the processes involved in the experiment. Orange wiggly arrows, pump pulses; blue straight arrows, excitonic population transfer processes considered in the kinetic modeling; black wiggly line, ultrafast exciton relaxation; red arrows, processes that can be disregarded under the conditions of the experiment.

