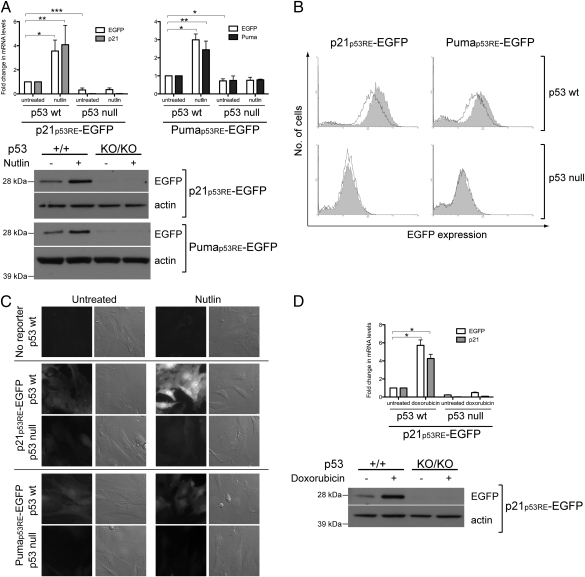
Fig. 3.
Induction of EGFP expression is p53-dependent. A, RT-qPCR (Upper) and Western blot (Lower) analysis of p21p53RE-EGFP and Pumap53RE-EGFP MEFs after overnight treatment with 10 μM nutlin, showing EGFP induction only in p53 wild-type (p53+/+) but not p53-null (p53KO/KO) MEFs. Changes in mRNA levels were determined relative to those in the respective untreated p53+/+ reporter MEFs. Error bars indicate SD of four independent experiments. *P < 0.02; **P < 0.05; ***P < 0.0005 (t test). B, Flow cytometric analysis of MEFs derived from p21p53RE-EGFP (Left) and Pumap53RE-EGFP (Right) mice that were either p53 wild-type or p53-null. The bold lines and shaded histograms correspond to untreated and nutlin-treated MEFs, respectively. Data shown are representative of three independent experiments. C, Fluorescence imaging of unfixed p21p53RE-EGFP and Pumap53RE-EGFP MEFs that were either p53 wild-type or p53-null, as well as of p53 wild-type MEFs lacking either reporter. The MEFs were treated with DMSO or 10 μM nutlin overnight. Bright-field images are included to illustrate the presence of nonfluorescent MEFs. D, RT-qPCR (Upper) and Western blot (Lower) analysis of p21p53RE-EGFP MEFs after overnight treatment with 400 nM doxorubicin showing EGFP induction only in p53 wild-type (p53+/+) but not p53-null (p53KO/KO) MEFs. Changes in mRNA levels were determined relative to those in untreated p53+/+ reporter MEFs. Error bars indicate SD of three independent experiments. *P < 0.01 (t test).

