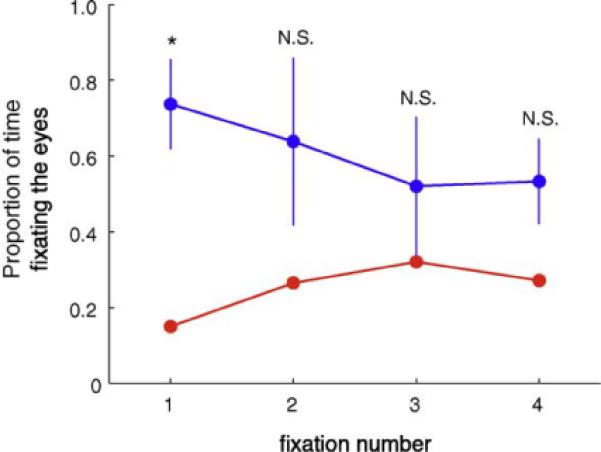
Fig. 5.

Proportion of time fixating the eye region across fixation number. SM (red) had fewer initial fixations to the eyes, but more so on subsequent fixations (control participants = blue). Errorbars reflect the standard deviation. *p = 0.005, N.S. = not significant. (For interpretation of the references to color in this figure legend, the reader is referred to the web version of the article.)
