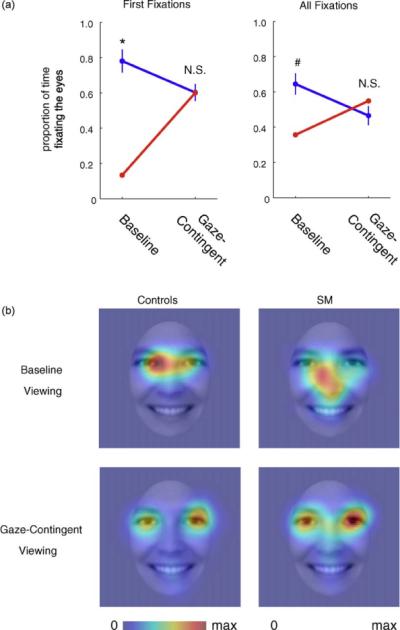
Fig. 7.

Gaze-contingent viewing of faces normalizes eye fixations in SM. (a) Line plots of the proportion of time fixating the eyes vs. non-eyes of the face for first fixations (left) and all fixations (right) during the baseline and gaze-contingent tasks. SM is shown in red, and comparison subjects are shown in blue. *p = 0.008, #p = 0.06 (trend). (b) Heatmaps across all fixations for SM and control participants during the baseline task and gaze-contingent task. The scale represents normalized fixation duration for each group separately, from no fixation to maximum fixation duration. Heatmaps are smoothed with a 27-pixel (2°) FWHM Gaussian filter.
