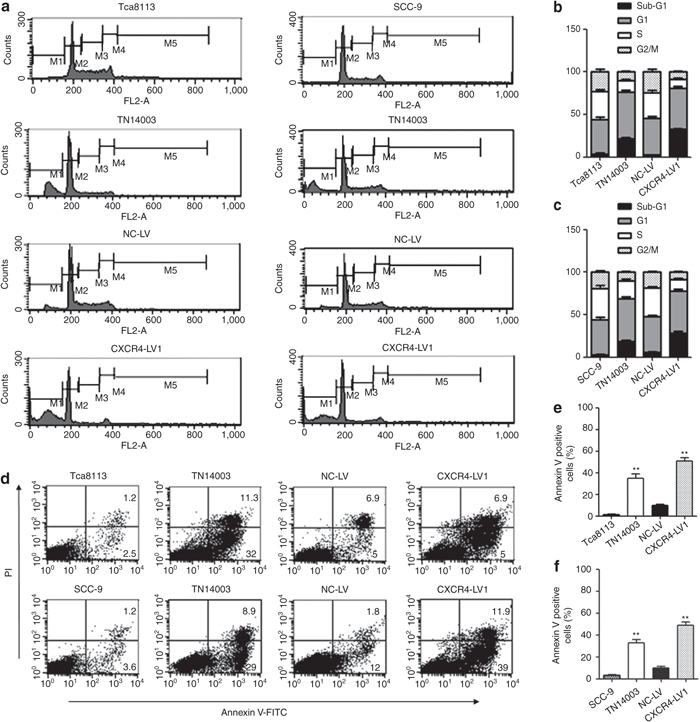
Figure 3.

Cell cycle and apoptosis analysis of Tca8113 and SCC-9 cells which were treated with CXCR4-LV1 and TN14003. (a) After 50 µmol/l TN14003 treatment for 8 hours and transduction with CXCR4-LV1 (MOI = 50) and NC-LV (MOI = 50) in Tca8113 and SCC-9 cells for 72 hours, cell nuclei were fixed, stained with PI, and analyzed by flow cytometry. Representative histograms are shown. (b) The fractions of Tca8113 cells in sub-G1 (black), G1 (2N; gray), S (white), and G2–M (4N; speckled) are shown. (c) The fractions of SCC-9 cells in sub-G1 (black), G1 (2N; gray), S (white), and G2–M (4N; speckled) are shown. Error bars indicate mean ± SD, n = 3 experiments. (d) Apoptosis cells were stained with Annexin V-FITC and were analyzed as described in the text (see Materials and Methods). PI indicates propidium iodide. (e) Quantitative analysis of positive Annexin V Tca8113 cells in different groups. (f) Quantitative analysis of positive Annexin V SCC-9 cells in different groups. Error bars indicate mean ± SD; n = 3 experiments; **P < 0.01.
