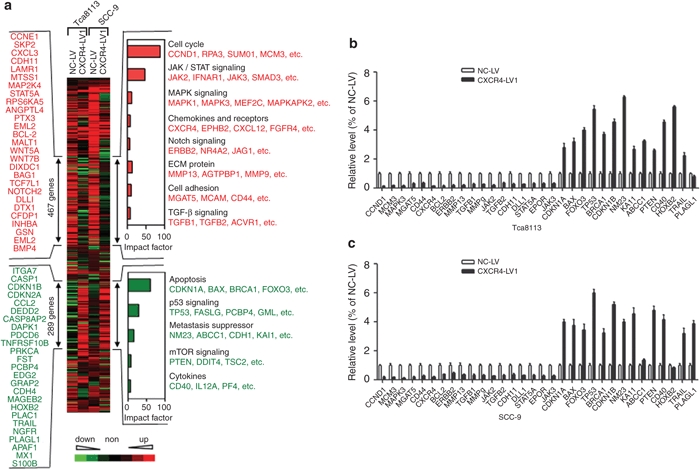
Figure 7.

Unsupervised clustering (Cluster 3.0 software) of differentially expressed genes between control siRNA and CXCR4 siRNA1 cells from both Tca8113 and SCC-9 cells. A total of 467 CXCR4-activated genes and 289 CXCR4-repressed genes are marked by double-headed arrows. Representative CXCR4-activated (red) and repressed genes (green) are listed either vertically or under each molecular pathway. Impact factor strength of CXCR4-activated (red bars) and repressed (green bars) genes is shown. (b) Quantitative analysis of transcript levels of over 30 genes identified by microarray analysis, relative to β-actin, determined by qRT-PCR and compared with Tca8113 cells transduced with NC-LV. (c) Quantitative analysis of transcript levels of over 30 genes identified by microarray analysis, relative to β-actin, determined by qRT-PCR and compared with SCC-9 cells transduced with NC-LV. Error bars indicate mean ± SD; n = 3 experiments. qRT-PCR, quantitative real-time polymerase chain reaction.
