Figure 4.

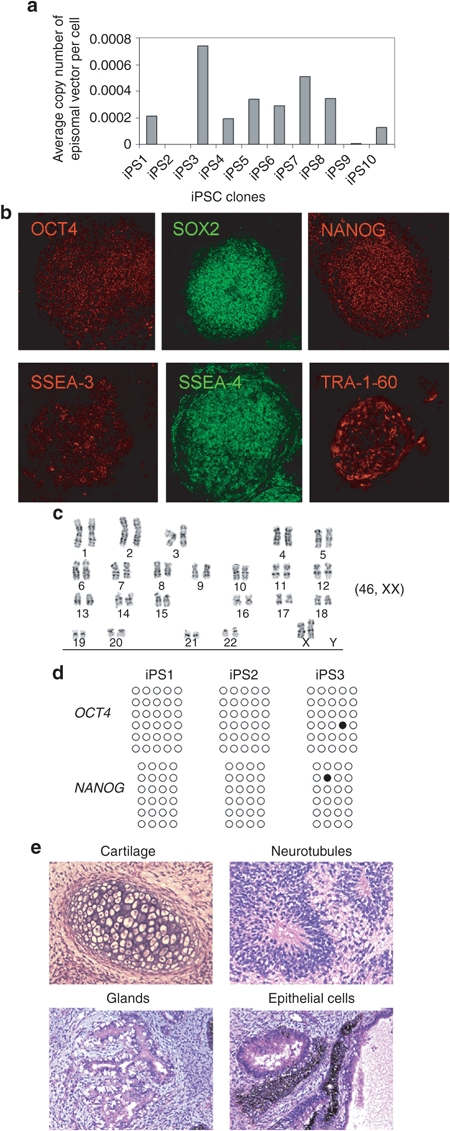
Characterization of induced pluripotent stem cells (iPSCs) generated with pCEP-OS. (a) Copies of residual episomal vectors after eight passages as indicated by real-time PCR. Data shown are from one pair of primers. Similar results were obtained with second pair of primers. (b) Immunohistochemistry analysis of a representative iPSC line showing expression of indicated pluripotency markers. Images were captured using the Zeiss LSM 710 confocal microscope with a ×10 objective. (c) A representative karyogram of an iPSC clone. All analyzed iPSC clones showed a normal karyotype. (d) Bisulphite genomic sequencing of the OCT4 and NANOG promoters indicates demethylation in three independent clones. Each horizontal row of circles represents an individual sequencing reaction of a given amplicon. Open and filled circles represent unmethylated and methylated CpG dinucleotides, respectively. (e) Hematoxylin and eosin (H&E) staining of representative teratoma from pCEP-OS cord blood (CB) iPSCs shows derivatives of three embryonic germ layers. Cartilage (mesoderm); neurotubules with rosettes (ectoderm); glands (endoderm); retina epithelial cells with pigments (ectoderm). Images were acquired using the Olympus microscope with a ×20 objective.
