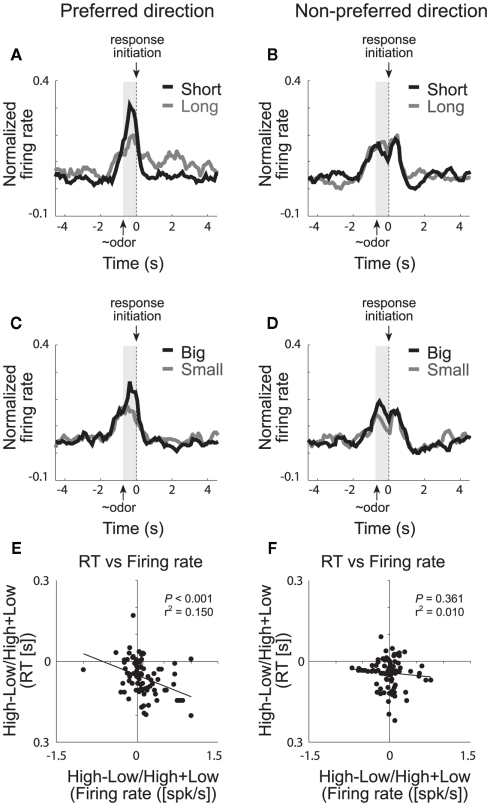
Figure 5.
Ventral striatum (VS). Population activity of odor-responsive neurons reflected motivational value and response direction on forced-choice trials. (A–D) Curves representing normalized population firing rate during performance of forced-choice trials for the odor-responsive neurons as a function of time under the eight task conditions (high value = black; low value = gray). Data are aligned on odor port exit. Preferred and non-preferred directions are represented in left and right columns, respectively. For each neuron, the direction that yielded the maximal response was designated as preferred. Correlations in the preferred (E) and non-preferred (F) direction between value indices (short − long/short + long and big − small/big + small) computed for firing rate (during odor sampling) and reaction time (speed at which rats exited the odor port after sampling the odor; adapted from Roesch et al., 2009).

