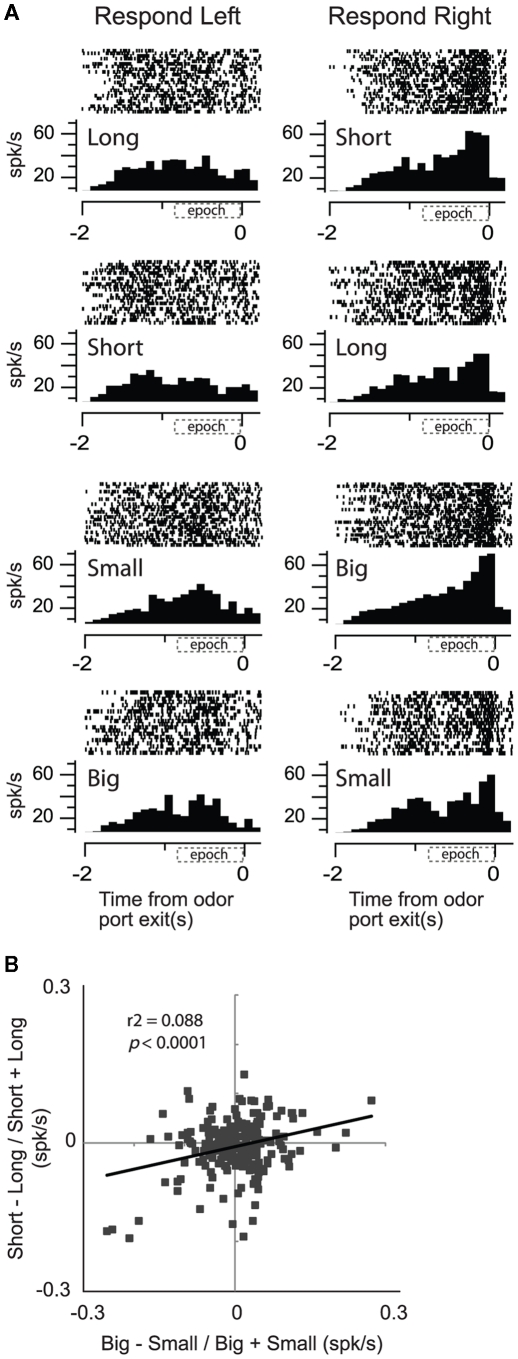
Figure 6.
Substantial nigra pars reticulata (SNr). Activity of single neurons in SNr reflects an interaction between expected value and direction. (A) Activity of a single SNr neuron averaged over all trials for each condition aligned on odor port exit during all eight conditions (four rewards × two directions). Histogram represents average activity over the last 10 trials (after learning) for each condition in a block of trials. Each tick mark is an action potential and trials are represented by rows. All trials are shown. (B) Correlation between size (big − small/big + small) and delay (short − long/short + long) effects averaged across direction (odor onset to odor port exit). Data was taken after learning (last 10 trials for each condition within each block; Bryden et al., 2011).

