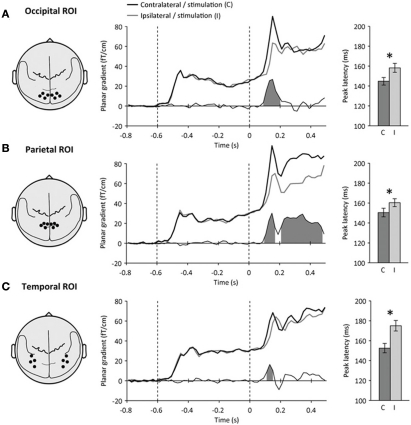
Figure 2.
Definition of regions-of-interest. Left: Schematic top view of the head showing the location of each sensor-space region-of-interest (ROI) with respect to the major anatomical landmarks of the brain. Middle: Time course of neuromagnetic event-related signals contralateral (black) and ipsilateral (gray) to visual stimulation at each ROI. Time is expressed relative to target onset (mask onset: +50 ms). The difference between contralateral and ipsilateral signals is shown below. Shaded areas indicate significant amplitude differences (p < 0.05). Right: peak latencies of neuromagnetic signals contralateral (C, dark) and ipsilateral (I, light) to stimulation. Error bars indicate within-subject s.e.m. Stars indicate significant latency differences (p < 0.05). (A) At the occipital ROI, a transient lateralization to visual stimulation was observed at 90–200 ms following target onset. (B) At the parietal ROI, a second, sustained lateralization was observed at 210–480 ms following target onset. (C) At the temporal ROI, the lateralization to visual stimulation was accompanied by a strong latency difference. Peak latencies were shortest at the occipital ROI, slower at the parietal ROI and slowest at the temporal ROI.

