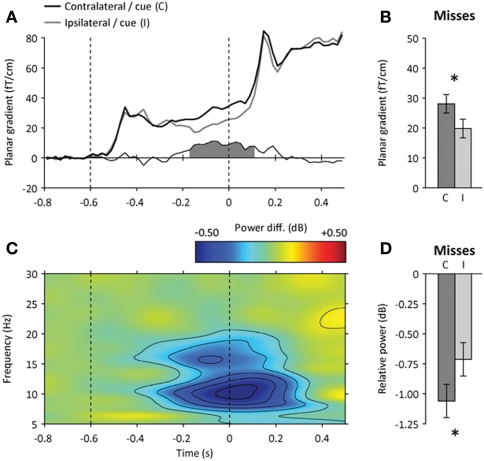
Figure 3.
Neural correlates of spatial attention before target onset. (A) Time course of event-related signals contralateral (black) and ipsilateral (gray) to the direction of the spatial cue at the parietal ROI. The amplitude difference between contralateral and ipsilateral signals is shown below. The shaded area indicates a significant amplitude difference from 200 ms before target onset (p < 0.05). (B) Amplitude difference between contralateral (C) and ipsilateral (I) signals for missed targets presented at the cued location (200–0 ms before target onset). Error bars indicate within-subject s.e.m. The star indicates a significant hemispheric difference (p < 0.05). (C) Time-frequency map of the difference in spectral power between parietal signals contralateral and ipsilateral to the direction of the spatial cue. The amplitude difference was accompanied by a focal suppression of ongoing alpha-band oscillations before target onset (in blue). (D) Contralateral attentional suppression of ongoing alpha-band oscillations for missed targets presented at the cued location.

