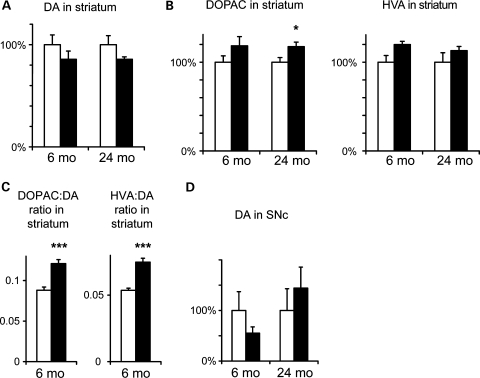
Figure 6.
Altered DA homeostasis in Ndufs4–DA mice. (A) DA levels in striatum in 6- and 24-month-old control and Ndufs4–DA mice (normalized to each control). The slight decrease of DA in Ndufs4–DA mice was significant only when both time points were combined (PGenotype= 0.04 by ANOVA). (B) Relative levels of DOPAC and HVA in striatum of 6- and 24-month-old control and Ndufs4–DA mice. Increased levels of both DOPAC and HVA in Ndufs4-DA mice were significant when both time points were combined (PGenotype< 0.05 by ANOVA). (C) DOPAC:DA and HVA:DA ratios in striatum (age 6 months). (D) Levels of DA in SNc in 6- and 24-month-old control and Ndufs4–DA mice (normalized to each control). Open bars, controls; black bars, Ndufs4-DA knockouts. Data shown as mean ± s.e.m. (n = 7–10). *P < 0.05; ***P < 0.001 by Student's two-tailed t-test following Levene's test for equality of variance.

