
Figure 2.
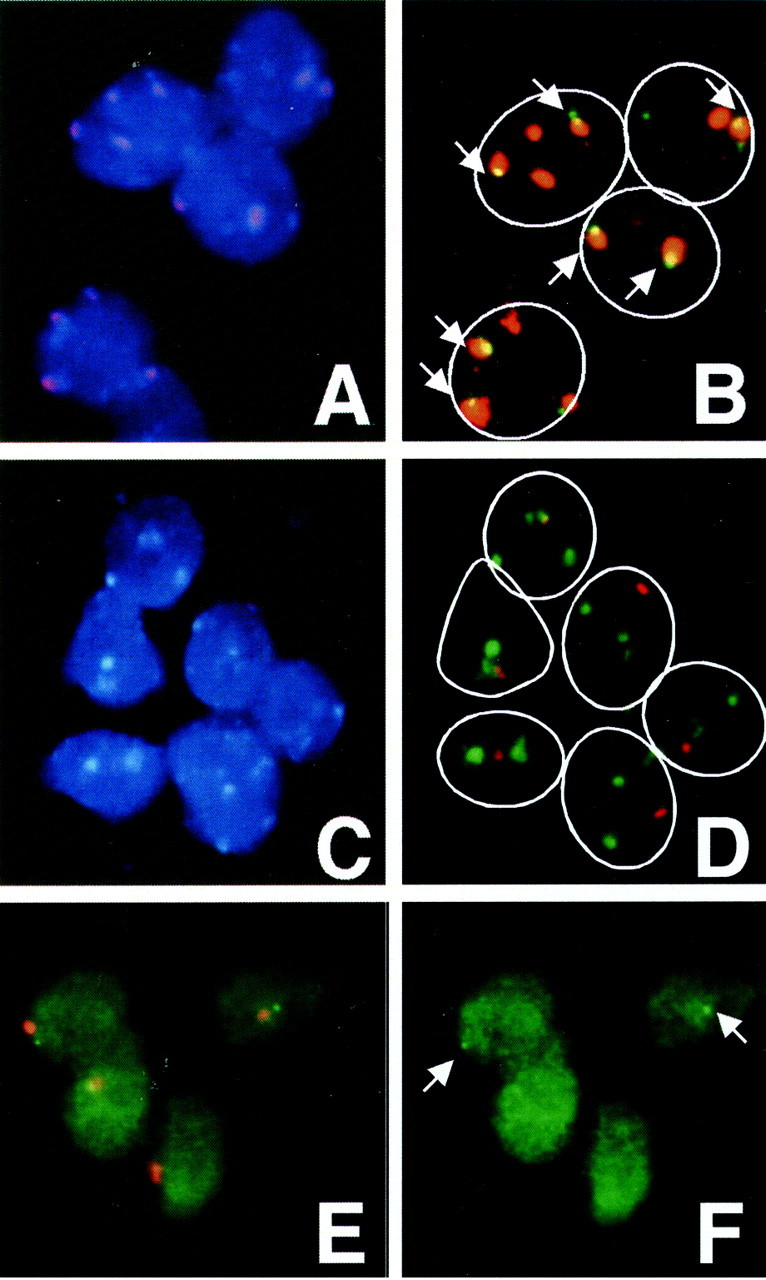
Numerical and structural alterations of chromosomes 16 and 1 in breast carcinomas detected by FISH. A and B: The two-color FISH visualizes two or three green signals of the D16Z2 locus and three or four red signals of the D1Z1 locus per nucleus. One or two signals are co-localized per nucleus (arrows). C and D: The two-color FISH visualizes one red signal of the D16Z3 locus and three or four green signals of the D1Z1 locus per nucleus. E and F: The two-color FISH visualizes one red signal of the D16Z3 locus and one green signal of the D16S154 locus (arrows) per nucleus. This carcinoma was assessed to have the mean copy score of 3 of chromosomes 16 and the score of 4 of chromosome 1 and to carry proximal 16q breakage and der(16)t(1;16)/der(1;16). The contour of tumor cell nuclei is surrounded by white lines in B and D. A and C: DAPI-FITC-Texas Red triple-band-pass filter; B, D, and E: FITC-Texas Red double-band-pass filter; F: FITC filter.