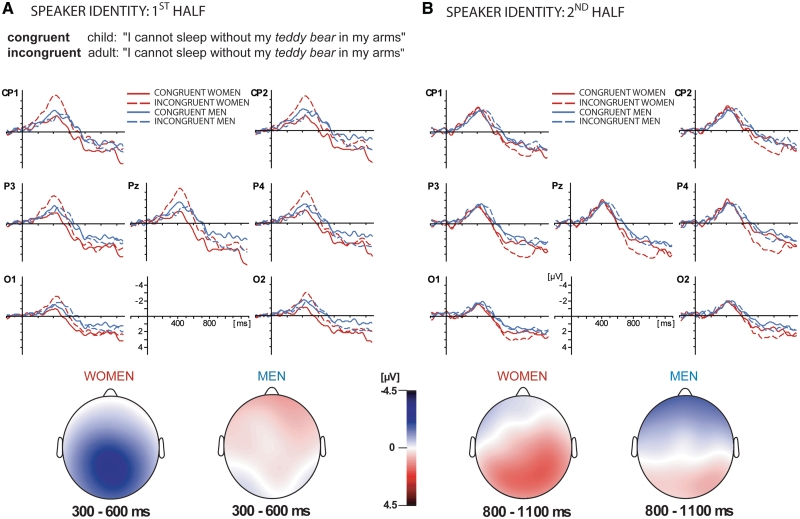
Fig. 2.
ERP waveforms of men (blue) and women (red) at seven posterior sites for Speaker Identity manipulation for (A) first half of experiment showing scalp distributions of N400 effects (incongruent minus congruent) per participant group and (B) second half of experiment showing scalp distributions of Late Positive effects (incongruent minus congruent) per participant group.

