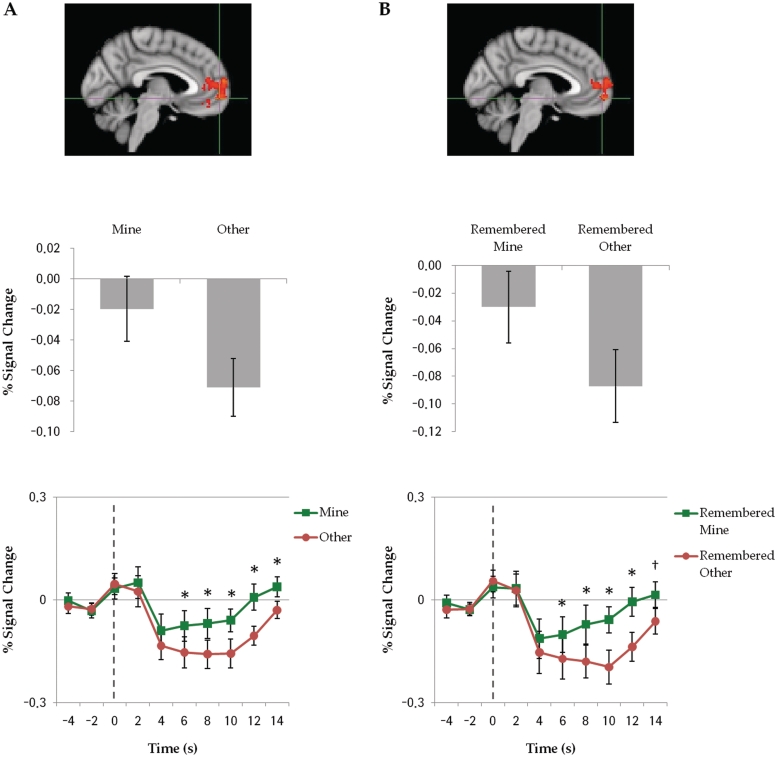
Fig. 4.
(A) Assignment contrast (Mine > Other) and (B) Source Memory contrast (Remembered Mine > Remembered Other). Top: activation map from whole-brain regression analysis; middle: mean percentage of signal change across all epochs of each event type within MPFC ROI; bottom: average time course of activity within ROI. Dotted line represents the trial onset. Time points with significant differences between event types are indicated with asterisk (†P < 0.08). Error bars indicate SEM.

