Figure 1.
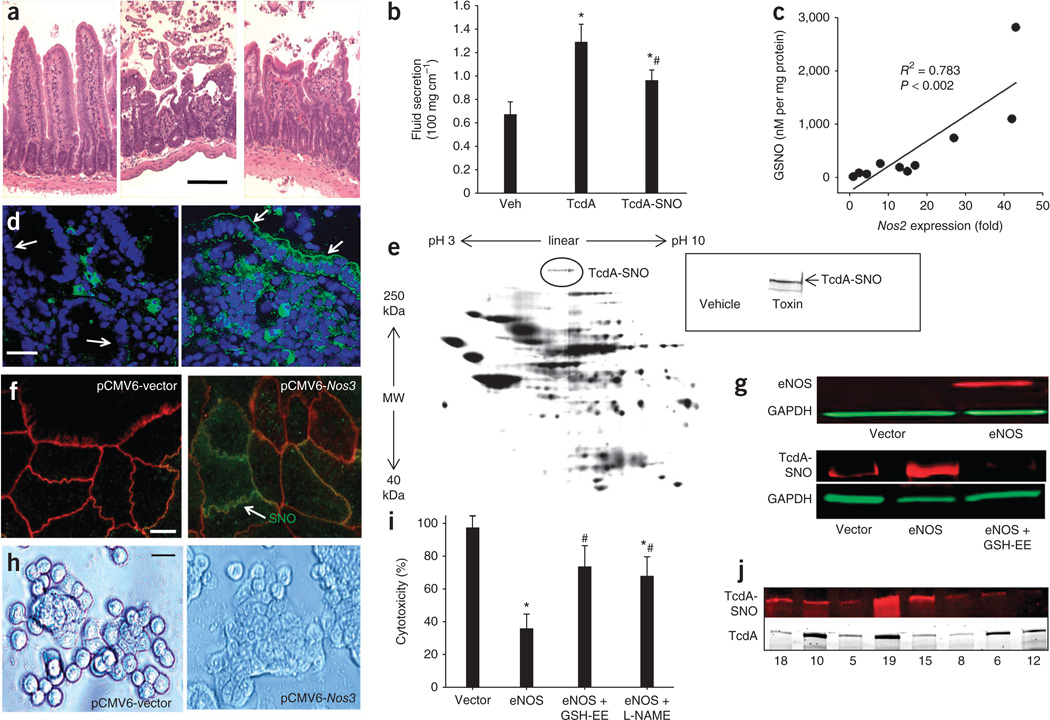
C. difficile toxins are S-nitrosylated in vivo. (a) H&E-stained sections of mouse ileum exposed to vehicle control (left), TcdA (middle) or TcdA-SNO (right) (10 µg toxin for 4 h; scale bar, 50 µm). (b) TcdA- or TcdA-SNO–induced fluid secretion in mouse ileal loops (10 µg for 4 h) (n = 4 per group; error bars show s.e.m.; P < 0.05 compared with vehicle (veh) control (*) and TcdA (#), respectively; analysis of variance (ANOVA) on ranks). (c) Tissue GSNO concentrations versus Nos2 mRNA expression levels in mouse ileal loops exposed to TcdA (10 µg) or vehicle for 4 h. (d) Anti-nitrosocysteine (SNO) immunofluorescence showing epithelial S-nitrosylation in human colitis (right) but not in histologically normal colon (left), where SNOs are largely confined to lamina propria cells (arrows illustrate brush border membrane; SNOs (green); DAPI nuclear counterstain (blue); scale bar, 20 µm). (e) SNO proteomics showing in situ S-nitrosylated proteins from TcdA-exposed mouse ileum labeled with BODIPY FL maleimide25. MW, molecular weight. Inset, biotin-switch assay using a C-terminus specific antibody to TcdA. (f) SNO immunofluorescence in Nos3-transfected Caco-2 cells. High SNO-protein levels (green) co-localize with membrane ZO-1 (red). Scale bar, 10 µm. (g) Top, immunoblot showing eNOS and glyceraldehyde-3-phosphate dehydrogenase (GAPDH) expression using IR-680 (red) and IR-800 (green) antibody labels, respectively, in vector- and Nos3-transfected Caco-2 cells. Bottom, immunoblots for TcdA-SNO and GAPDH (using IR-680 (red) and IR-800 (green) antibody labels, respectively), after immunoprecipitation with nitrosocysteine-specific antibodies in vector- and Nos3-transfected Caco-2 cells exposed to TcdA. TcdA-exposed cells were also treated with GSH-ethyl ester (GSH-EE) to remove NO groups from proteins (control). (h) TcdB-induced cell rounding in vector (left) versus Nos3 (right) transfected Caco-2 cells (71.1 ± 14.9% versus 26.5 ± 8.2%, respectively ± s.e.m., n = 3; P < 0.05, Mann-Whitney U test on ranks) (scale bar, 25 µm). (i) MTT assay for cytotoxicity in vector and Nos3-transfected Caco-2 cells exposed to 3.7 nM TcdB for 10 min. Controls included cells treated with GSH-EE and L-NAME (n = 3; error bars show s.e.m.; P < 0.05 compared to vector control– (*) and Nos3- (#) transfected cells, respectively; Mann-Whitney U test on ranks). (j) Immunoblots showing TcdA-SNO (top; labeled with IR-680) in human stool (n = 8) samples positive for TcdA (bottom; labeled with IR-800). TcdA-SNO was first immunoprecipitated from stool samples with a nitrosocysteine-specific antibody, and samples were then probed for TcdA. Presence of toxin in the stool was independently confirmed by ELISA and immunocytotoxicity assay30 (Supplementary Fig. 4).

