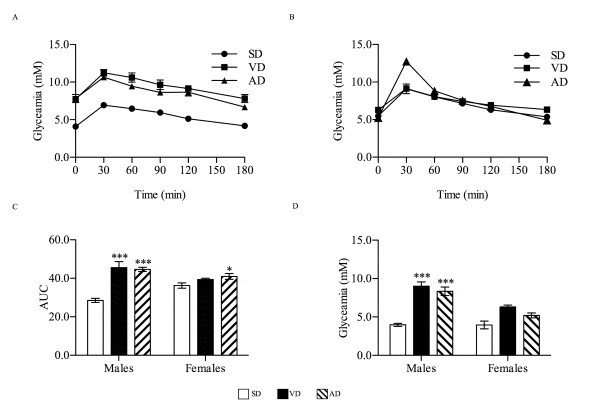
Figure 2.
Glycemic parameters. After overnight fasting, IPGTT challenge was carried at the end of the protocol in males (A) and females (B) (n = 9). From these curves, AUC were calculated to estimate glucose tolerance in corresponding mice (C). Fasting glycæmia (D) was measured at the beginning of the IPGTT. * P < 0.05, *** P < 0.001 vs. SD.

