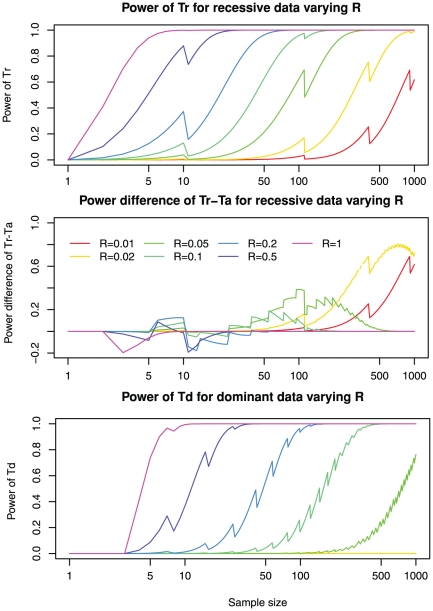
Figure 2. Genes underlying highly heterogeneous diseases can be identified by sequencing a moderate sized sample.
The calculated power with varying degrees of genetic heterogeneities (R) ranging from 0.01 to 1 is shown. Upper panel: power of Tr for detecting a recessive gene; Middle panel: power difference Tr-Ta for detecting a recessive gene; Lower panel: power of Td for detecting a dominant gene. Other parameters are fixed to the default values: number of mutations m = 300; total number of genes M = 20,000; sensitivity of detecting mutations Ps = 0.8; and the mutation probability equals genome-wide average w = 1. See Tables S2, S3 and S4 for more dense sampling of R values. Note that power does not always increase monotonously with sample sizes (zigzag line patterns). The loss of power upon increase of sample size is related to discrete changes in the significance level cutoff  of the test and thus very small test size (not close to 0.05) as shown in Table S1, since the distribution of the test statistic is discrete.

