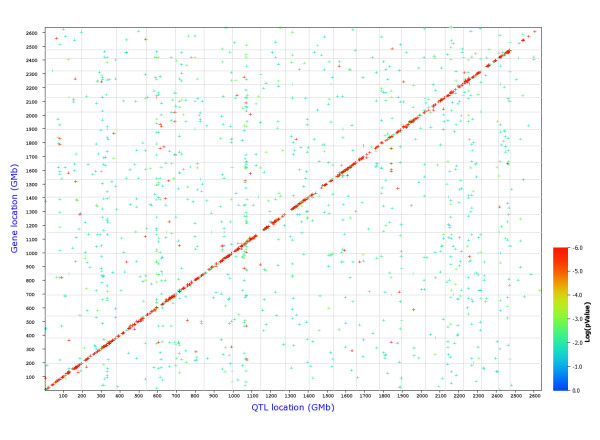
Figure 2.
Genome-wide graph of cis- and trans-eQTLs in Th cells. The positions of the eQTLs are plotted against the locations of the corresponding transcript along the genome. Cis-regulated genes are located at the diagonal, all other dots represent trans-regulated genes. The significance level of each QTL is indicated by the color. FDR = 0.3.

