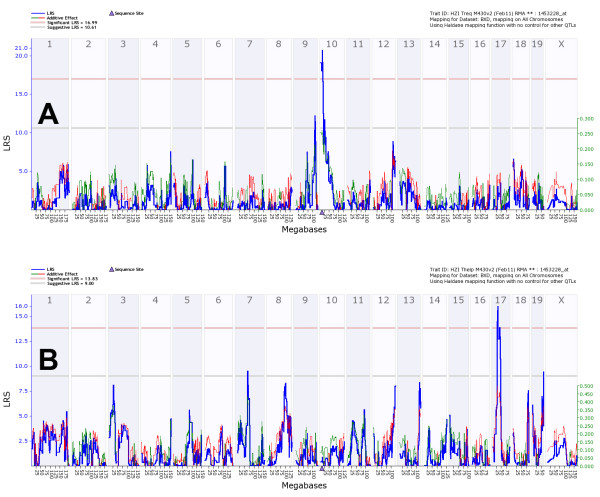
Figure 3.
Genome wide eQTL mapping of Stx11 transcript in Treg and Th cells. (A) eQTL map for Stx11 (probeset 1453228_at) in Tregs and (B) in Th, respectively. The numbers at the top are chromosomes, and positions at the bottom are given in megabases along the chromosome. The blue line represents the significance level of the QTL expressed as LRS score (likelihood ratio statistic). A positive additive coefficient (green line) indicates that DBA/2J alleles increased trait values. A negative additive coefficient (red line) indicates that C57BL/6J alleles increased trait values. The two horizontal lines mark the genome-wide significance levels at p < 0.05 (red line) and p < 0.37 (gray line). A blue triangle marks the position of the gene.

