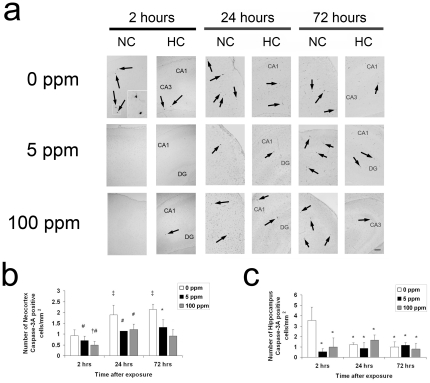
Figure 2. Activated caspase-3 decreases following CO exposure.
Immunohistochemistry for activated caspase-3 was performed on coronal sections 2 hours (hrs), 24 hrs, and 72 hrs post exposure. (a) Representative sections imaged at 10× from somatosensory neocortex (NC) and hippocampus (HC) obtained at the 2-hour time point, 24 and 72 hours following 3-hour exposure to air (0 ppm CO), 5 ppm CO, or 100 ppm CO are depicted. Activated caspase-3 positive neurons undergoing degeneration within the boxed in region in layer IV of the somatosensory neocortex are magnified in the inset of the 0 ppm CO section 2 hours post exposure. Black arrows indicate activated caspase-3 stained cells. CA1, CA3, dentate gyrus (DG) regions of HC are labeled. Scale bars, 100 µm. Quantification of activated caspase-3 stained cells in (b) neocortex and (c) hippocampus are demonstrated. Values are expressed as means plus standard deviation. (b) *P<.05 vs. 0 ppm 72 hrs. ‡ P<.05 vs. 0 ppm 2 hrs. # P<.05 vs. 0 ppm 24, 72 hrs. † P<.05 vs. 5 ppm 24, 72 hrs. (c) *P<.02 vs. 0 ppm 2 hrs. N = 3–4 animals per cohort.

