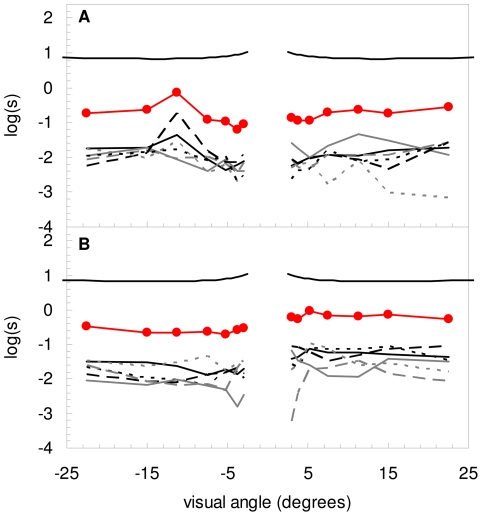
Figure 4. PSF of 6 individual pits (bottom 6 curves in each figure) for the IOL of a) figure 2a and b ) figure 2b .
The line with closed circle symbols represents the estimated total contribution of all pits in the IOL. The top PSF illustrates the PSF-model, according to the CIE, of a 35–year-old individual.

