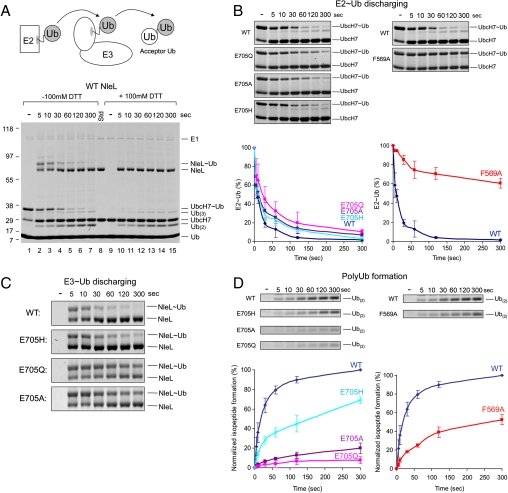
Fig. 5.
Single-turnover experiments. (A) The schematic presentation (up) and SDS-PAGE stained by Coomassie blue (bottom) of the overall reaction. Lanes: 1, Precharged E2 before addition of NleL; 2–7, time course of the reaction; 8, protein standards. Lanes 9–15, same samples as in lanes 1–7 but with the addition of 100 mM DTT in sample loading buffer to distinguish the presence of thioester bonds from isopeptide bonds. (B) Time-course of Ub discharging from E2. The intensities of the UbcH7 ∼ Ub bands were quantified and plotted over time normalized by the total amount of UbcH7 ∼ Ub. Gel insets for the plot are also shown. (C) Gel insets showing time-course of Ub transferring from NleL to acceptor Ub. (D) Time-course of polyUb chain formation. The amount of isopeptide bond formation was calculated based the intensities of Ub(2) + Ub(3) bands (Ub(2) + 2 × Ub(3)) and normalized by that of the wt protein at the 300 s time point. Gel insets of Ub(2) bands are shown. The error bars show the standard deviation from three independent experiments.

